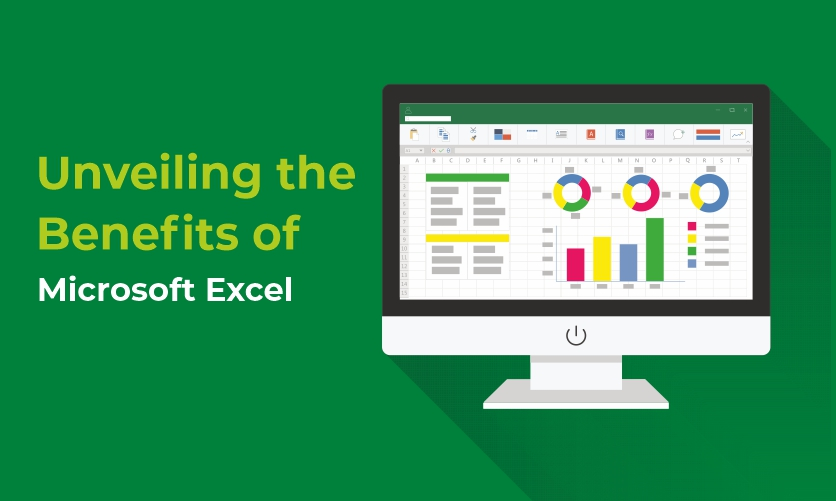
Unveiling the Benefits of Microsoft Excel
Microsoft Excel is a widely used spreadsheet software that has become an essential tool in today’s digital age. It serves a myriad of purposes across various industries, from basic data entry to complex financial modeling. In this blog post, we will explore the extensive benefits of Microsoft Excel. We will delve into its versatile features and the ways in which it empowers users to streamline tasks, make informed decisions, and enhance overall productivity.
Table of Contents
Data Organization and Management:
Data organization and management are critical components of any successful business. Microsoft Excel offers a robust set of tools for organizing and managing data, making it an essential tool for businesses of all sizes. With Excel, users can easily sort, filter, and analyze data sets of any size, making it easier to identify patterns, trends, and areas for improvement.
Excel’s built-in functions and formulas allow users to manipulate and transform data quickly, saving time and effort. Additionally, Excel’s PivotTable feature enables users to create interactive summaries of large data sets, providing a comprehensive overview of the data at a glance.
Overall, Excel’s powerful data organization and management capabilities make it an indispensable tool for businesses looking to enhance their productivity and efficiency.
Calculation and Formulas:
Microsoft Excel is widely known for its powerful calculation and formula capabilities. With Excel, users can perform complex calculations and create custom formulas to automate tedious tasks, saving time and effort.
Excel’s built-in functions cover a wide range of mathematical operations, including basic arithmetic, statistical analysis, and financial calculations. Users can also create custom formulas to perform specific calculations or manipulate data in unique ways.
Excel’s formula auditing tools make it easy to identify errors or inconsistencies in complex formulas, ensuring accurate results. Additionally, Excel’s conditional formatting feature allows users to apply formatting rules based on specific conditions, making it easier to highlight important data and identify trends.
Overall, Excel’s calculation and formula capabilities make it an essential tool for businesses and individuals who need to perform complex calculations or automate repetitive tasks.
Data Visualization and Charts:
Microsoft Excel is a powerful tool for data visualization and creating charts. With Excel, users can easily create professional-looking charts and graphs to help illustrate data trends and patterns.
Excel offers a wide range of chart types, including column, bar, line, pie, scatter, and more. Users can customize the appearance of charts by changing colors, fonts, and styles, making it easy to create charts that match their company’s branding.
Excel’s charting capabilities go beyond just creating basic charts. Users can also add trendlines, create combination charts, and add secondary axes to better convey complex data sets. Excel also offers dynamic charting features, allowing users to update charts automatically as data changes.
Overall, Excel’s data visualization and charting capabilities make it an essential tool for businesses and individuals looking to communicate complex data in a clear and concise manner.
Collaborative Work and Sharing:
Excel offers great features for working on a spreadsheet together with others. Here’s what you need to know:
Sharing the File:
- Cloud storage: Save your workbook on a cloud platform like OneDrive or SharePoint. This allows others to access the file from anywhere and any device.
- Share settings: Use the “Share” button to grant edit or view permissions to specific individuals or groups. You can also set an expiration date for the link.
Co-authoring:
- Real-time editing: With modern versions of Excel and online versions, multiple users can edit the same file simultaneously. Changes appear in real-time for everyone.
- Cell highlighting: Colored outlines appear around cells being edited, indicating who’s working on what.
- Chat & comments: Use built-in chat or comment features to communicate and leave notes for your collaborators.
Version control:
- File history: Track changes and revert to previous versions if needed. Excel automatically saves backups when co-authoring.
- Conflicts: When two users edit the same cell simultaneously, Excel prompts you to choose which version to keep.
Additional tools:
- Conditional formatting: Highlight specific data or changes for better visibility during collaboration.
- Formulas & pivot tables: Share complex calculations and data summaries in an interactive way.
- Macros & add-ins: Automate repetitive tasks and enhance collaboration workflow.
Important points:
- Software compatibility: Ensure everyone working on the file uses compatible versions of Excel to avoid formatting issues.
- Communication & workflow: Establish clear communication channels and agree on a workflow to avoid confusion and conflicts.
- Security: Be mindful of data security when sharing a file, especially if it contains sensitive information.
- Start by clearly outlining what your project is all about. What are you trying to achieve? What are the key deliverables?
- Having a well-defined scope will help you break down the project into manageable tasks and make informed decisions throughout the process.
- Once you have a clear understanding of your project scope, it’s time to break it down into smaller, actionable tasks.
- List each task in a spreadsheet, along with its estimated duration, resources required, and any dependencies on other tasks.
- Use Excel’s Gantt chart functionality or simply create a table to visualize your project timeline.
- This will help you see how the tasks are interconnected and identify any potential bottlenecks.
- Determine who will be responsible for each task and allocate resources accordingly.
- This will help ensure that everyone is aware of their role and accountable for their deliverables.
- Use Excel’s built-in tools to track the progress of your tasks, such as conditional formatting and progress bars.
- Identify and mitigate potential risks by brainstorming possible issues and developing contingency plans.
- Share your project plan with stakeholders and keep them updated on progress.
- Use Excel’s charting and reporting features to create visually appealing presentations and reports.
- Use templates: There are many free and paid Excel templates available online that can save you time and effort.
- Format your spreadsheets: Use colors, fonts, and borders to make your spreadsheets easy to read and understand.
- Utilize formulas: Excel has a wide range of formulas that can automate calculations and save you time.
- Integrate with other tools: Excel can be integrated with other tools, such as Microsoft Project, for even more functionality.
- Profitability ratios: These ratios measure the company’s ability to generate profit, such as the gross margin, net profit margin, and return on equity (ROE).
- Liquidity ratios: These ratios measure the company’s ability to meet its short-term obligations, such as the current ratio and quick ratio.
- Solvency ratios: These ratios measure the company’s long-term financial health and ability to meet its long-term obligations, such as the debt-to-equity ratio and the interest coverage ratio.
- Projecting income statements: This involves forecasting future revenue, expenses, and profits based on historical data and assumptions about future growth, market conditions, and other factors.
- Projecting balance sheets: This involves forecasting future assets, liabilities, and shareholder equity based on the projected income statement and assumptions about future investments, financing activities, and dividend payments.
- Projecting cash flow statements: This involves forecasting future cash inflows and outflows from operating, investing, and financing activities.
- Flexibility: Excel allows users to create custom spreadsheets that are tailored to the specific needs of their analysis.
- Ease of use: Excel has a user-friendly interface that is relatively easy to learn, even for users with limited technical skills.
- Accessibility: Excel is readily available and relatively affordable compared to other specialized financial modeling software.
- Versatility: Excel can be used for a wide range of financial analysis and modeling tasks, from simple ratio calculations to complex forecasting models.
- Protecting sensitive data: Excel offers basic features like password protection, sheet protection, and cell encryption to safeguard confidential information.
- Limited scope: While useful for individual files, Excel lacks advanced security features like access controls, activity logs, and intrusion detection for broader data systems.
- Simple tracking: Excel allows manual data tracking through formulas and tables, enabling basic record-keeping and change logs.
- Limited analysis: Complex tasks like compliance checking, anomaly detection, and user behavior analysis require specialized audit tools beyond Excel’s capabilities.
- Excel can be a helpful starting point for simple data security and auditing needs.
- For comprehensive protection and deep analysis, rely on dedicated security and auditing solutions.
- Macros and add-ins can extend Excel’s security and auditing capabilities but require caution due to potential vulnerabilities.
- Cloud-based data storage offers additional security features and simplifies access control and audit records.
- Tweak the interface: Change ribbon options, create custom toolbars, and adjust cell formatting to work efficiently.
- Build bespoke formulas and functions: Automate calculations, analyze data, and extend Excel’s capabilities to suit your unique tasks.
- Design intuitive dashboards and reports: Present information visually and dynamically for better understanding and decision-making.
- Connect to external data sources: Access data from databases, websites, APIs, and other files directly within Excel.
- Automate workflows: Trigger actions, export reports, and update data automatically using macros and Power Automate.
- Collaborate seamlessly: Share spreadsheets, track changes, and work together in real-time with colleagues.
- Understanding Credit Notes in Tally Prime: A Comprehensive Guide - April 26, 2024
- 50+ SAP MM Interview Questions and Answers Revealed - April 19, 2024
- Tally Prime on Mobile: Revolutionizing Business Management On-The-Go - April 5, 2024
If you are looking to learn accounting in detail then explore the courses here
Elevate Your Accounting SkillsAchieve Accounting Excellence with Expert Instructors |
|
| Browse Classroom Course | Browse Online Course |
Project Management and Planning:
Microsoft Excel is a surprisingly powerful tool for project management and planning, especially for small to medium-sized projects. Its flexibility and familiarity make it a popular choice for individuals and teams who want to get organized and stay on track.
Here’s how you can use Excel for effective project management and planning:
1. Define your project scope and objectives:
2. Break down the project into tasks:
3. Create a timeline:
4. Assign resources and responsibilities:
5. Track progress and manage risks:
6. Communicate effectively:
Here are some additional tips for using Excel for project management:
Remember, Excel is just a tool. The success of your project will ultimately depend on your planning, communication, and execution. However, when used effectively, Excel can be a valuable asset for project management and planning.
Financial Analysis and Modeling :
Financial analysis and modeling in Excel are powerful tools used to assess the financial health of a company and forecast its future performance. By building and manipulating spreadsheets, analysts can gain valuable insights into various aspects of a business, such as profitability, liquidity, and solvency.
Financial Analysis
Financial analysis involves using historical financial data to understand a company’s current financial position and performance. This typically involves calculating and interpreting various financial ratios, such as:
By analyzing these ratios, investors and analysts can gain insights into a company’s strengths and weaknesses, identify potential risks and opportunities, and make informed investment decisions.
If you are looking to learn more about Excel, check out these articles
Financial Modeling
Financial modeling involves building spreadsheets to forecast a company’s future financial performance. This typically involves:
By building and analyzing financial models, businesses can make informed decisions about investments, financing, pricing, and other strategic initiatives.
Benefits of Using Excel for Financial Analysis and Modeling
Excel is a widely used and readily available tool that offers several benefits for financial analysis and modeling, including:
However, it is important to note that Excel also has limitations, such as its susceptibility to errors and its lack of built-in features for data validation and automation.
If you’re interested in learning more about financial analysis and modeling in Excel, there are many resources available online and in libraries. There are also a number of training courses and certifications available that can help you develop your skills in this area.
I hope this provides a helpful overview of financial analysis and modeling in Excel. Please let me know if you have any other questions.
Data Security and Auditing :
Data Security:
Auditing:
Summary:
Additional points:
Read more about Excel here
Customization and Integration :
Excel’s power lies in its ability to be both tailored to your specific needs and connected to various data sources and applications.
Customization:
<ul”5:1-8:0″>
Integration:
By mastering customization and integration, you can transform Excel from a basic spreadsheet tool into a powerful platform for enhancing productivity, automating tasks, and gaining insights from your data.
Conclusion:
In conclusion, Microsoft Excel stands as a versatile and indispensable tool with a myriad of benefits for users across diverse industries. Its prowess in data organization, calculation, visualization, collaboration, project management, automation, financial analysis, security, and customization makes it an unparalleled software solution. As we continue to navigate the digital landscape, Excel remains a cornerstone for individuals and businesses seeking to optimize their workflows, make informed decisions, and achieve unparalleled efficiency. Embrace the power of Excel, and unlock a world of possibilities in data management, analysis, and collaboration.


